Statistical Testing of Random Generators
Sci report | June 21, 2022
One of the most vital components in the world of cryptography, statistical simulations and models are the so-called random number generators. These software algorithms or hardware devices produce a stream of unpredictable random bits. Checking the output data quality is crucial for the applicability and reliability of the given generator [5]. For this purpose, many algorithms and methods have been created. The use of so-called statistical test batteries is unalterable and mandatory, especially when it comes to developing a new type of generator, regardless of whether it is a software (Pseudorandom Number Generator, PRNG ) or a hardware device (True Random Number Generator, TRNG). In this article, we will present the statistical tests and the procedures for checking the operation of our quantum USB hardware generator GTR-01. We have used the following test batteries: Diehard, TestU01 and NIST STS. In all procedures performed, GTR-01 always operates in its default mode with bitwise XOR between channels.
Diehard
George Marsaglia developed these tests in the 1980s. In 1995, he published a CD-ROM containing random number files, compiled executable files of the Diehard tests, and files with documentation and instructions for use [3]. The battery consists of 18 statistical tests in total. Although slightly outdated, these algorithms have become classics and have inspired many improvements.
Due to the lack of the source code, we used the C# shell of the original executable files (compiled on FORTRAN for MS-DOS) that are called from the .NET console application. For each battery startup 80,000,000 random bits (10,000,000 bytes) are initially generated as a binary file, which serves as an argument to the original .exe files. Chi-Square and Kolmogorov-Smirnov uniformity tests are applied to the obtained 234 p-values, and a conclusion about the test outcome is made. In its procedures, Diehard uses the significance level α = 0.01. GTR-01 passes all tests successfully! The execution time of the whole battery is about 15 s on a personal computer with Windows 10, Intel Pentium CPU G4600@3.60GHz and 8GB RAM (DDR4 2400MHz).
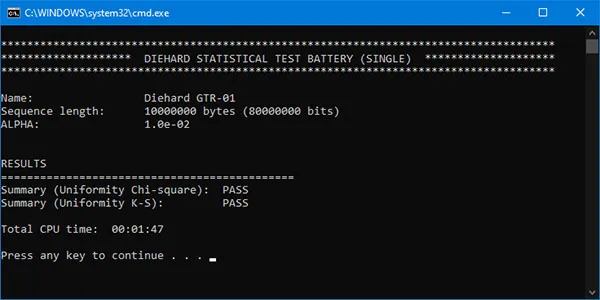
It is important to note that Diehard uses only approximations of statistical distributions in its algorithms. When sequentially applying the battery to multiple binary files (e.g., 50, 100, or more) and evaluating the resulting p-values, there is a strong deviation from the uniform distribution. Therefore, the tests are only suitable for a single assessment as originally proposed by Marsaglia.
TestU01
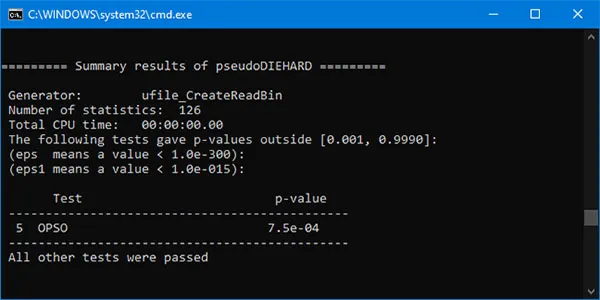
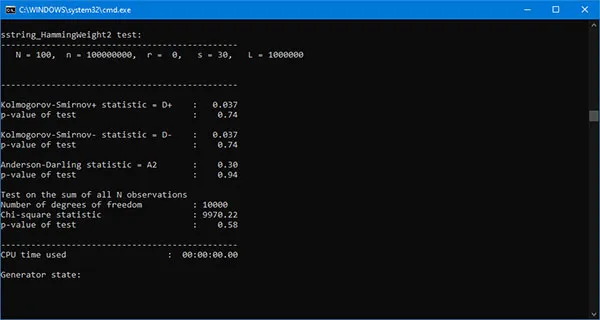
The tests are developed by Pierre L’Ecuyer and presented for the first time in 2007 [1][2]. They consist of several statistical batteries: SmallCrush (10 tests), Crush (96) and BigCrush (106). In addition, TestU01 includes PseudoDIEHARD (containing most of Diehard's original tests), Alphabit (specially designed for hardware random generators), Rabbit, and FIPS-140-2 (developed according to the NIST specifications). All tests use a significance level of α = 0.001. Whole suit is written in ANSI C for UNIX operating systems, so we recompiled the source code for MS Windows using Visual C++ Express Edition 2008. A binary file with 8,000,000,000 random bits (1,000,000,000 bytes) is initially generated and SmallCrush, PseudoDIEHARD, FIPS-140-2, Rabbit and Alphabit are executed in a sequence. The total execution time is about 40 minutes. This procedure is repeated many times and GTR-01 passes all tests successfully! The figure below shows the results of PseudoDIEHARD.
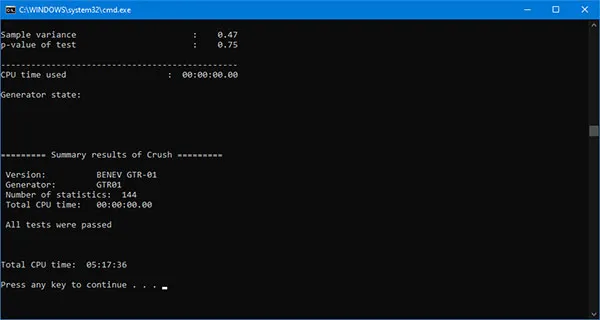
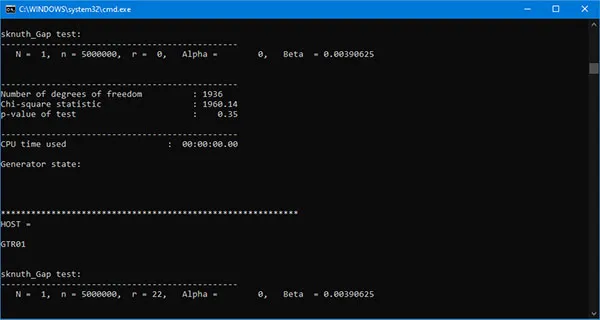
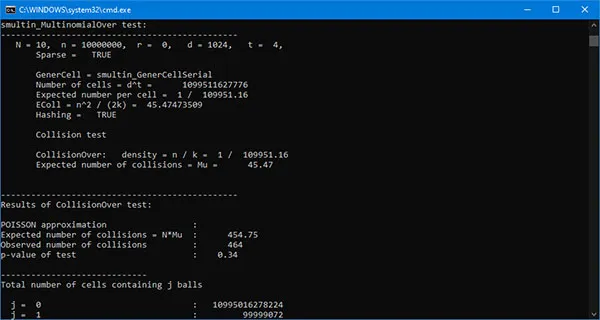
The Crush is executed independently from the other batteries, again detecting the total time to complete all 96 tests. Unlike the previous case, where the same binary file is generated and used sequentially for the individual batteries, here, for each Crush test, the program automatically generates a new sequence of random bits. As a result, the execution time increases drastically. One battery execution takes approximately eight days! As a final result, we can draw the following conclusion:
GTR-01 passes successfully all tests in TestU01 Crush battery!
The following figures show the results for some of the tests in Crush.
NIST statistical test suite
The test suite is published by the National Institute of Standards and Technology (NIST) [6]. Currently, the battery includes 15 statistical tests. The code is free, which allows some modifications and experimentation with the tests. In practice, these algorithms have become a standard for checking the reliability of all modern random number generators, whether pseudorandom generators or hardware ones. The original source code (written in C) was rewritten in C# for .NET and tested to ensure full compliance between the two variants. Based on this code, we have constructed a general procedure that includes all tests, some of which are in different variations, depending on their input arguments. It accepts 1, 10, 100 or 1000 binary sequences of random bits of length between 1,000,000 and 10,000,000 bits. The following tests are included:
- Frequency Monobit.
- Frequency Block (n/80).
- Runs.
- Longest Run of Ones.
- Binary Matrix Rank (7x7).
- Binary Matrix Rank (8x8).
- Binary Matrix Rank (15x15).
- Binary Matrix Rank (16x16).
- Binary Matrix Rank (31x31).
- Binary Matrix Rank (32x32).
- Binary Matrix Rank (63x63).
- Binary Matrix Rank (64x64).
- Discrete Fourier Transform (Spectral).
- Non-overlapping Template Matching (9).
- Overlapping Template Matching (9)
- Universal
- Linear Complexity (1000).
- Serial (2).
- Serial (8).
- Serial (14).
- Approximate Entropy (2).
- Approximate Entropy (8).
- Approximate Entropy (14).
- Cumulative Sums (forward).
- Cumulative Sums (backward).
- Random Excursions.
- Random Excursions Variant.
Non-overlapping Template Matching consists of 148 independent tests, Serial - 2, Random Excursions - 8 and Random Excursions Variant - 18. The total count of tests is 201. Random Excursions and Random Excursions Variant make an internal validity check. If not satisfied, the algorithm returns zeros, and the results of these tests are ignored. When this happens, the total number of tests becomes 175. The conclusion of the success of a given test is made after checking the p-value against the accepted significance level α. If the p-value ≥ α, the test is considered successful. The tests are conducted for α = 0.001, 0.005, 0.01, 0.05, 0.1. All 201 tests are considered statistically independent [6].
The latter allows us to construct an overall assessment of the success of the entire test procedure. We consider each test in the battery as an independent random Bernoulli trial with two possible outcomes: success with probability p = 1 - α and failure with a probability of α [9]. When conducting n independent trials (tests), the number of successful outputs is a random variable with a Binomial distribution. Thus, from the Cumulative distribution function (CDF), we can calculate the cumulative probability in a given interval out of n experiments, each with a probability of success p [9]. Thus, we determine the minimum number of C successful trials required to consider the test procedure successful. We use the following equation:
P{X ≤ C | n, p} = ∑k = 0⌊C⌋(kn)pk(1 - p)n - k = α
For example, let n = 201, α = 0.01, p = 0.99, where we get C = 194. Therefore, if the number of successful tests is equal to or greater than 195, we consider the whole procedure successful with the significance level of α. If we exclude the Random Excursions and Random Excursions Variant results, then n = 175 and C = 169. A similar approach is described in [8].
When the random sequences are more than one, i.e. 10, 100 or 1000, an additional assessment is made for the uniformity of the distribution of p-values. We use three independent methods:
- Proportion. According to the above formula, we calculate a total estimate for the whole set of tested binary sequences at n = 10, 100 or 1000 and significance level α. The overall assessment of the 201 tests performed so far is considered an independent Bernoulli trial with p and α. Thus, the C is determined for the different values of n.
- Chi-Squire. In this estimation, we use the above values for α, in contrast to the significance level of 0.0001 proposed in [6].
- Kolmogorov-Smirnov. To calculate this statistic, we use the procedure described in [7]. It is an improved version of the algorithm shown in [4].
Numerous tests with binary sequences of different lengths in series of 10, 100 and 1000 sequences are performed. Finally, we can conclude the following:
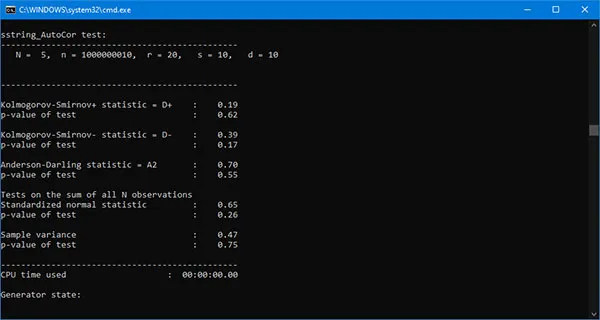
GTR-01 successfully passes all test procedures in NIST STS!
The following figure shows an output window with typical test results.
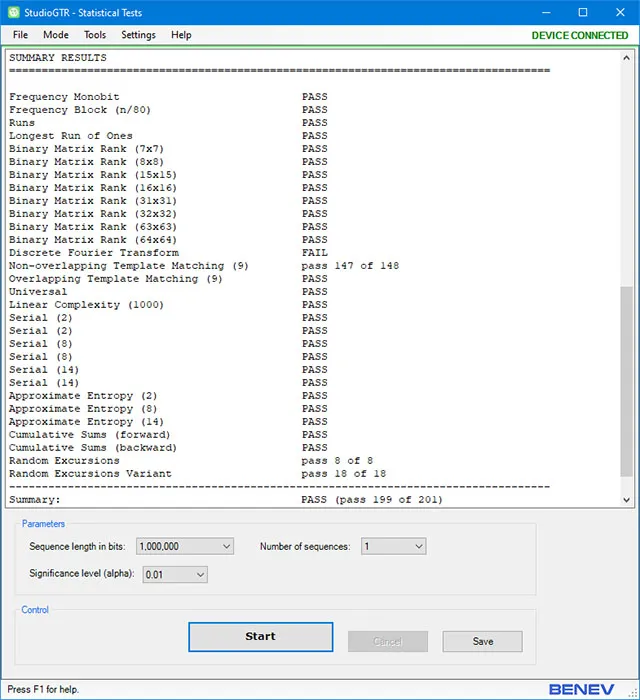
NIST STS is part of the StudioGTR – a specially developed .NET GUI application to work with GTR-01. The software allows different values of α to be set. More information can be found on the StudioGTR description page.
It is important to note the following. Considering the operation of random number generators, we must not forget that we are working with random events described in the concept of probability distributions, so nothing is absolutely accurate. For example, sometimes, it can happen that the test result, for all tests in a battery, is 100% successful. Great! Sometimes one of the p-values may be less than the specified significance level, and the test may formally fail. In the world of probabilistic events, this is quite normal. But we must be careful. If the 100% successful result is repeated constantly (the probability of this considering a really good random generator is negligible), it would be a clear indication of a problem in the methodology or the tests themselves. It is necessary to remember that we deal with random variables. In any case, a reliable assessment of the quality of the generator can only be obtained after performing numerous tests and carefully analyzing the results.
Conclusion
The described procedures and statistical tests demonstrate the excellent quality of the binary data generated by GTR-01. Moreover, our methodology using the built-in software support allows for quick and easy calibration and testing of each device unit. That can be done not only in the production stage but also periodically during the operation of the generator. Thus, ensuring the quality of the output data.
Reference
- L’Ecuyer P., Simard R.
TestU01: A C library for empirical testing of RNGs
, ACM Transactions on Mathematical Software, Vol. 33, No. 4, Article 22, 2007. - L’Ecuyer P., Simard R.
TestU01: A software library in ANSI C for empirical testing of random number generators
, User’s guide, 2013. - Marsaglia G.
The Marsaglia random number CDROM, with the Diehard battery of tests of randomness
, 1995. - Marsaglia G., Tsang W., Wang J.
Evaluating Kolmogorov's distribution
, Journal of Statistical Software, 8(18), pp. 1-4, 2003. - Marton K., Sucio A.
Towards a methodology for randomness assessment: challenges and pitfalls
, Proceedings of the Romanian Academy, Series A, Vol. 16, pp. 385-394, 2015. - Rukhin et al.
A statistical test suite for random and pseudorandom number generators for cryptographic applications
, National Institute of Standards and Technology, SP 800-22 Rev. 1a, 2010. - Simard R., L’Ecuyer P.
Computing the two-sided Kolmogorov-Smirnov distribution
, Journal of Statistical Software, Vol. 39, Issue 11, 2011. - Sys et al.
On the interpretation of results from the NIST statistical test suite
, Romanian Jurnal of Information, Science and Technology, Vol. 18, pp. 18-32, 2015. - Димитров Б., Янев Н.
Вероятности и статистика
, Софтех, II изд., 2007.